

Hear music the way it was intended to be reproduced - conclusion
Entry posted by mitchco
If you have followed this series on a quest for proper timbre, I have reached a conclusion. From wikipedia, in psychoacoustics, timbre is also called tone quality and tone color. No question, music source, electronics, interconnects, power, etc., all have impact on timbre. However, the biggest factor on reproducing proper timbre, by orders of magnitude, is the speaker to room interface which is limited by small room acoustics: http://www.gcmstudio.com/acoustics/acoustics.html
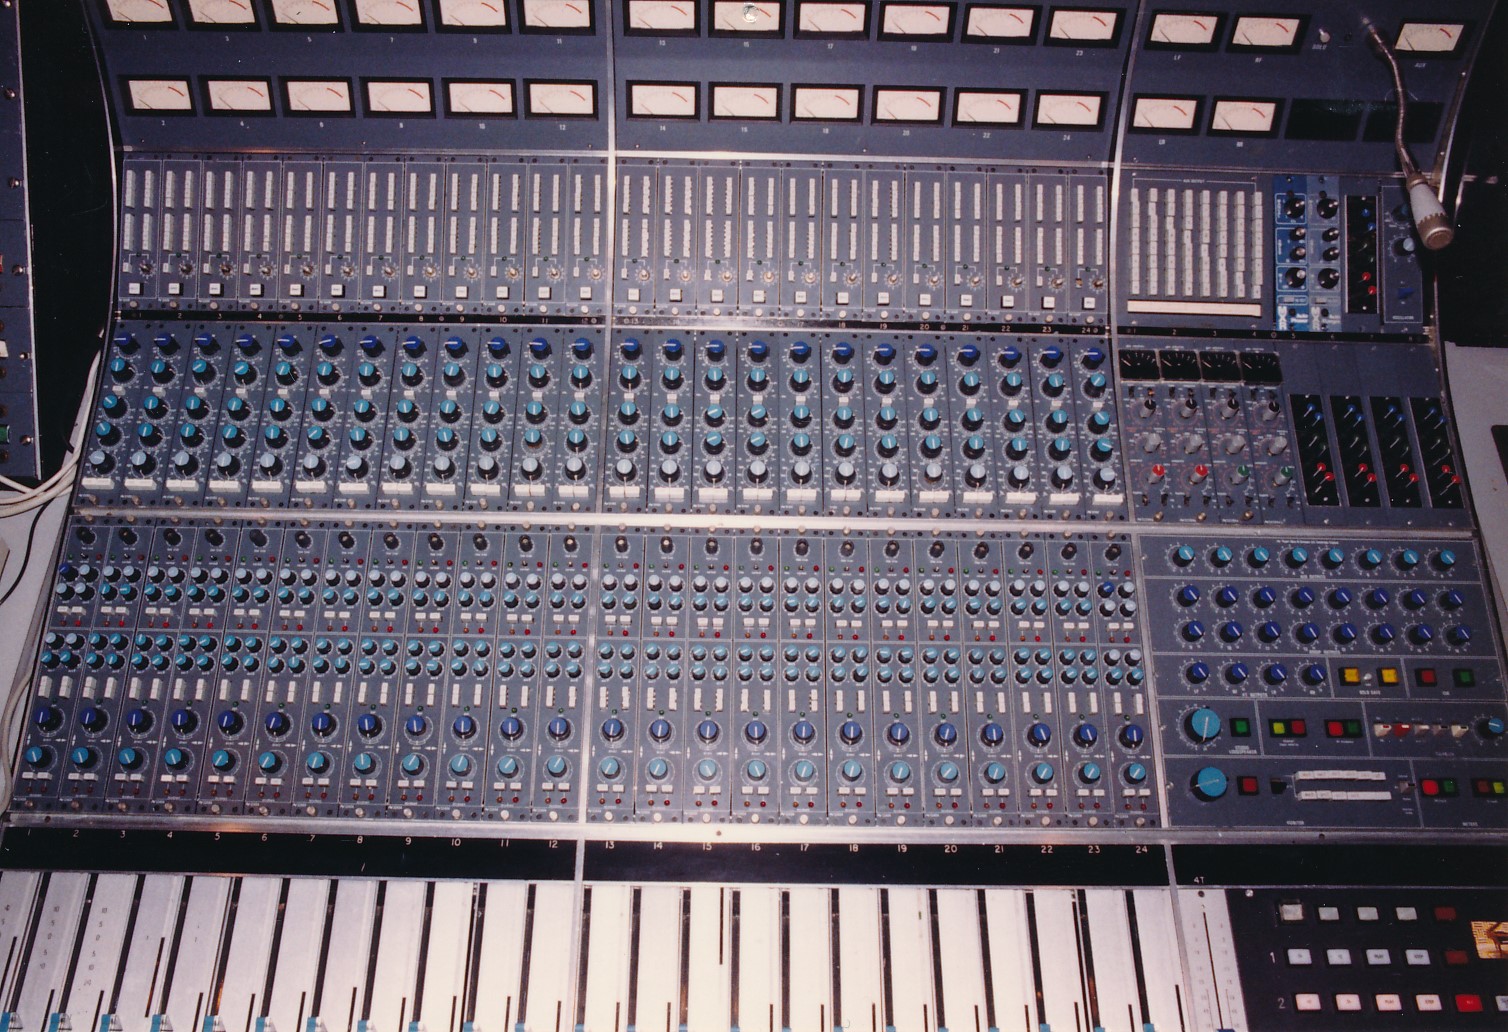
I was lucky to have worked in several recording studio control rooms. The LEDE control rooms are custom designed to produce the absolute best possible sound quality (i.e. timbre). Certified LEDE studio control rooms costs hundreds of thousands (and into the millions) to design, build, and certify. After logging over ten thousand hours of recording/mixing time in these rooms, every other rooms sounds (very) poor in comparison, including my current room.
As much as I would like to, building a properly designed LEDE room, outfitted with the state of the art diffusers, absorbers and bass traps, is not feasible. When I designed my computer audiophile system, I looked into Digital Room Correction (DRC) software. These series of posts have been about calibrating the speaker to room interface using well known industry standards and measures (i.e. B&K house curve, equilateral triangle, room mode calculator, RT60, etc.).
Before we look at some of the final measurements and analysis, a small aside on the measurement setup. Audiolense measures speakers and room. Based on those measurements, DRC filters are designed and hosted in an external to Audiolense program called a Convolver. I have a Convolver in JRiver as my default music player and a standalone Convolver when I am listening to MOG or Netflix.
Normally, I will perform the measurements using Audiolense on my audio computer with a Lynx L22 sound card. However, I wanted to measure sound in 3D (i.e. time, energy, and frequency like my old TEF computer), sometimes called waterfall plots. Ideally you want the calibrated frequency response (i.e. B&K house curve), so once the sound stops, it decays away at the same rate and ends at the same time across the frequency range. The easiest way to display this visually is using the waterfall plot.
Because Audiolense does not have a waterfall plot function, I used another fine piece of measurement software called REW: http://www.hometheatershack.com/roomeq/ I also used a different computer (laptop) and its internal sound module to perform the measurements. I was concerned that using different software and computer/sound module would introduce too much variability to the measurements.
I took a measurement using Audiolense and then the exact same measurement using REW. I cut n pasted the output of both and superimposed the 2 over each other as best as I could. While I was able to get the frequency scales to line up, my inability to line up the vertical scale shows a little variability within 2db. If I could match the vertical scales,the variability would be even less. The important point is that as is, our ears would hear the two as being identical.

The measurement is a high resolution picture of the frequency response at the listening position. I have zoomed the vertical scale and used 1/12th octave smoothing to show a detailed view. We can see a variation of 22db between the lowest dip and highest peak. This article on Small Room Acoustics explains the theory behind why that is: http://www.gcmstudio.com/acoustics/acoustics.html What I am impressed about is the tight tolerance between the two measurements but using different software and computer/sound card combinations. It is good to see this level of consistency.
That variance of 22db is typical in most small room acoustic listening rooms. Let's compare that variance to something in the electronic domain like my Lynx L22 sound card. It is ruler flat from 15Hz to 50Khz.

Here is the onboard sound module in my Dell Precision M6400 laptop. Its frequency response measures 20Hz to 20Khz +0.3 to -0.3db

This is exactly what I mean by the speaker to room interface having orders of magnitude more influence on timbre than anything else in the audio signal chain. Because of small room acoustics theory and measurement, most of our critical listening rooms have peaks, dips, honks, booms, and resonances. While generally speaking, electronics, cables, everything matters, have orders of magnitude less variance in frequency response, but also less distortion than speakers.
Here is a waterfall plot of my left speaker with the measurement mic in the listening position. Vertical scale is energy, measured in decibels. The horizontal scale is the frequency range from 20Hz to 20Khz. The Z scale is time in milliseconds. Starting at 0 time (i.e. measurement mic) and the decay to 300 milliseconds or a 1/3 of a second or given that sound travels a foot per millisecond, the sound has traveled roughly 300 feet in the room. That's a lot of reflections in my 30'L x 16'W x 8'H listening room.
As an aside, all measurements below were taken at the same sound pressure level within +- 0.5 db tolerance.

Classic dips and peaks of small room acoustics below 500Hz. I get 26db difference between the maximum dip at 45Hz and the honking spike at 200Hz. That is a large variance.
Here is the same measurement, but with Audiolense frequency DRC applied. Ignoring the B&K house curve slope, we are about +-3.5db across the listening range. That is a major improvement from +- 13db in the raw frequency response above. Also note the more even decay time across the frequency range.

Here is the waterfall plot with Audiolense True Time Domain (TTD) DRC applied.

Very interesting as the TTD DRC has really smoothed out the bottom end and extended it to 20Hz. Even more so than just with frequency DRC.
Let’s get serious and zoom on in below 500Hz as that's where the listening room has its maximum influence on the sound - i.e. room modes as per small room acoustics.

This room has a few problems for sure, even though it is typical of small room acoustics. Meaning if you take a frequency response measurement of your system at the listening position, you are likely to see something similar. Unless you have a nice large room (+56 feet length) or a golden room ratio or a LEDE room.
Here is the waterfall plot with frequency DRC applied. It is within +-3.5 db from 25Hz to 500Hz with a nice decay.

With TTD DRC applied:

We are seeing +-3db from 20Hz to 500Hz, with a real nice even decay. It can't get any better than that. If you look close, you will see it is labeled as TTD-11. I designed a dozen or so TTD filters, each time adjusting my filters in the Audiolense Correction Procedure Designer. The 11th version of tweaking the filters resulted in the best quality sound (i.e. timbre), both from a measurement and listening perspective.
The sound difference is as dramatic as the graphs depict. And sounds exactly as the graphs depict. With TTD applied, the sound is full, smooth, and crystal clear. A major improvement, bordering on as good as it gets.
I am impressed with Audiolense DRC. I can't listen to my system without it. With DRC in circuit, it sounds similar to the LEDE rooms I used to work in. It does not sound like my room anymore. The peaks, dips, honks, booms, and resonances are gone. The only acoustic treatment is a 10' x 7' throw carpet between the listening position and speakers.
If I looked at what it cost me for Audiolense, the measurement mic and preamp, it is almost criminal as to how good the results are for the investment. In my previous post, I have seen small fortunes spent on diffusers, absorbers, and bass traps. Look at the pictures.
In order to get the level of small room acoustics under control, comparable to Audiolense, I would have to purchase a lot of sound treatment. If I look at the value I am getting comparing the two, the cost of Audiolense and mic/preamp would only buy 2 RPG diffusers. It is likely I would require 6 to 10 or more diffusers for the back wall, depending on diffuser size. Something would need to go on the ceiling, even at a minimum, that would be 2 to 4 diffusers. Then likely 2 or 4 bass traps.
And that is why I have reached my conclusion. With DRC, the frequency response is +-3db throughout the listening range. The honks, booms, and resonances are gone in the time domain. The sound arrives at my ears at the same time, sounds full, super tight, and crystal clear - no more small room acoustics curse!
More acoustic treatment may help, but given the cost and how good the system sounds/measures with Audiolense DRC, I feel I am at the point of diminishing returns. I would need to spend several thousand dollars in acoustical room treatments to match what I can get with Audiolense DRC. Ideally, I would love to have both as then a full-on LEDE room may be possible. But for now, I am really enjoying my un-room. For once hearing proper timbre outside the studio control room.
Now that my system has been calibrated to reproduce the best possible timbre, I can really start hearing music the way it was intended to be reproduced.
I hope you found these series of posts useful in determining the best possible way to achieve proper timbre in the speaker to room interface.
Happy Listening!
Mitch


15 Comments
Recommended Comments