Puma Cat
2 Followers

-
 Just in the interests of accuracy, I'll also add, that in addition to functioning as a streamer with built-in DAC, that the Lumin P1 is also an excellent preamplifier. Honestly, one of the best I've ever heard or used, and uses the LEEDH volume control. It's so good as a preamplifier, as a matter of fact, I'm using it in place of the fully dual-mono First Sound preamplifier I was using prior.
 -
Using Design of Experiments to optimize subwoofer set-up
Puma Cat replied to Puma Cat's topic in Headphones & Speakers
One of the really powerful things about DOEs, is you can build a good model, it can be use to show the "response" of the measurement(s) under study. Now, most folks are just taught in school about fairly simple approaches to characterizing a response, e.g. using a linear regression, where the output is plotted as straight line based on the levels of the input factors. An example are the plots from the Sub's DOE showing the influence of Sub Crossover (XO) and Gain on the model. These plots are simple linear regression plots. Basically, you turn Knob "X" and you get response "Y" changing in a linear proportion to the change in X. But...DOEs are much more powerful than that, and can shown the nature of....interactions. For example, take the Time*Temp interaction when doing something as simple as...baking cookies. It's not Time and it's not Temp that produces a properly baked cookie, it's the INTERACTION of Time*Temp that produces a properly-baked coookie. This is important to understand because University typically does not teach or demonstrate the influences of INTERACTIONS to students when teaching science or engineering. Instead they teach OFAT: One Factor At a Time. Unfortunatly, often times the real world simply does not work in as simplistic a manner as OFAT. Here's an example of what DOEs can also do: this is a response surface plot from the Sub DOE above depicting the INTERACTION between sub GAIN and sub CROSSOVER at the 155 Hz room mode. As is obvious, the fuctional response is not a simple staight line e.g. in a linear regression. It's 3-dimensional shape that has curvature and complexity to it. And..if you rotate the response surface cube around, you see more of the actual shape of the 3-dimensional response curve of the 155 Hz room mode. The operative point here being is to really fully characterize and thus, understand, what's going on your room with your components and speakers[b][i] interacting [/i][/b]with the room itself (remember, Danny will tell you that the room itself is one of the most important factors), tools such as DOEs provide INSIGHT into the settings you'll need to obtain the best, real-world response. Don'tcha just love...(real) SCIENCE? 😉 -
Using Design of Experiments to optimize subwoofer set-up
Puma Cat replied to Puma Cat's topic in Headphones & Speakers
The nice thing about using DOEs is, it's takes the guesswork out of optimizing a system. You literally obtain F-statistics and p-values that specify how accurately the DOE model "explains" the entirety of the measurement data for your system under experimentation. In statistics, we generally set our confidence level at 95% confidence, which means the alpha-risk (which the chance you're willing to reject the null hypothesis when it is in fact true, i.e., accept the risk of the model "being wrong") is set to 0.05 (5%). What this means, basically, is that any DOE model with a p-value < 0.05 is considered to be statistically significant with respect to having 95% confidence or greater. In the case of this DOE model for integrating the REL sub, our p-value is 0.0016, which means we have 99.84% confidence that this model explains the actual data observed. And...that's pretty darn good statistical confidence. DOEs are incredibly powerful tools and you can use it for many audio applications. For example, you could use it to optimize speaker placement, or cartridge alignment and setup. -
Using Design of Experiments to optimize subwoofer set-up
Puma Cat replied to Puma Cat's topic in Headphones & Speakers
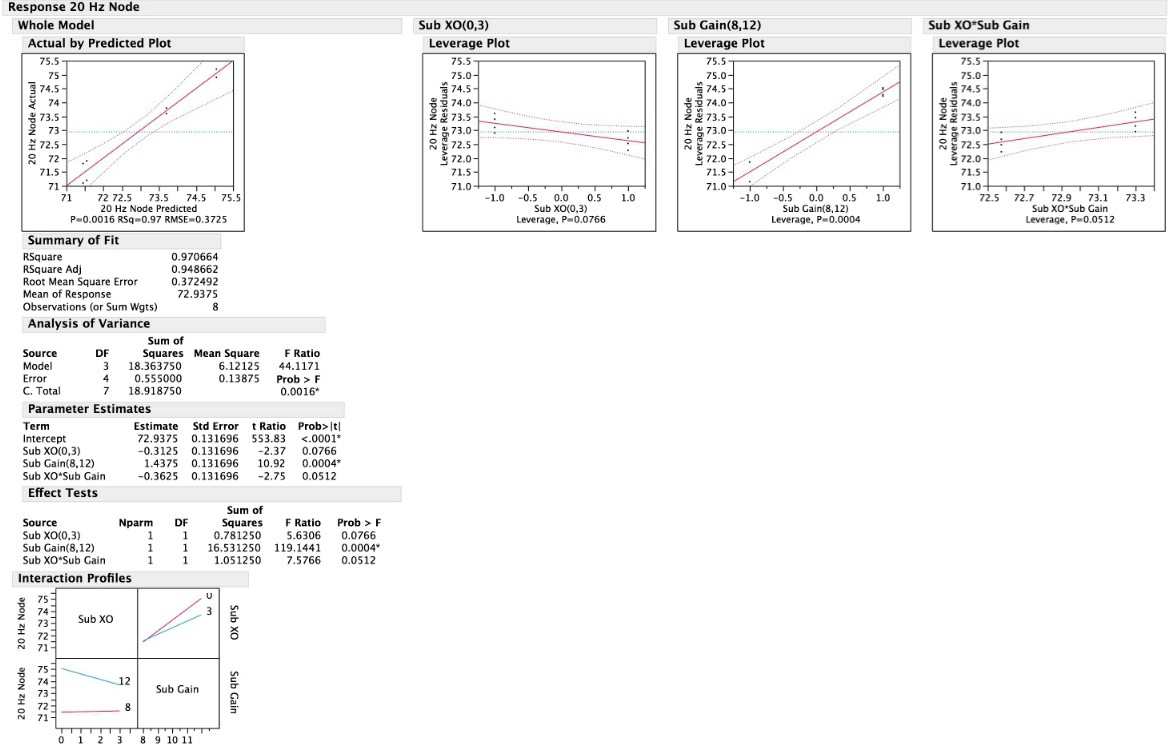
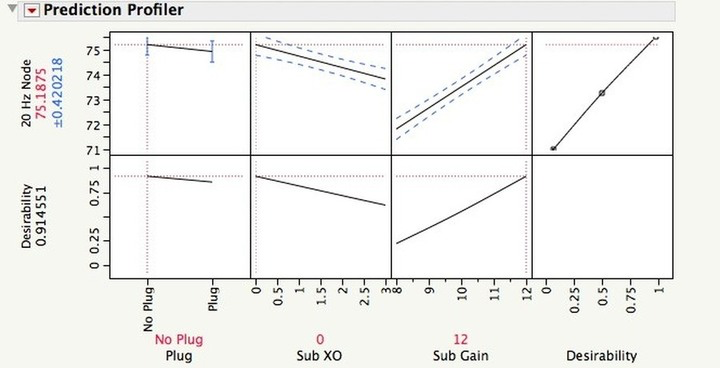
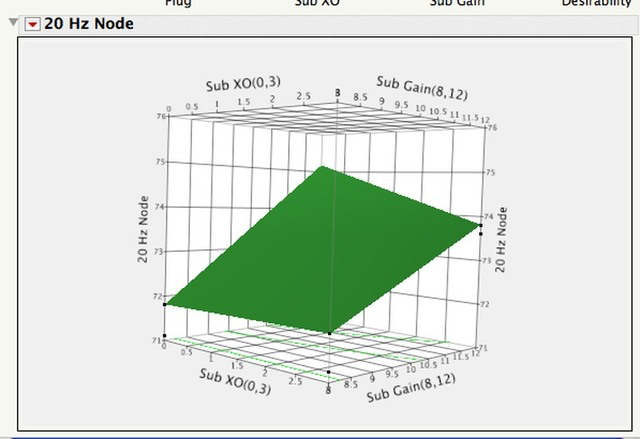
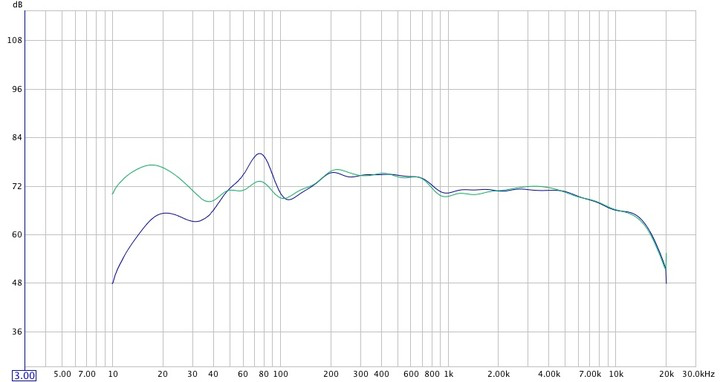
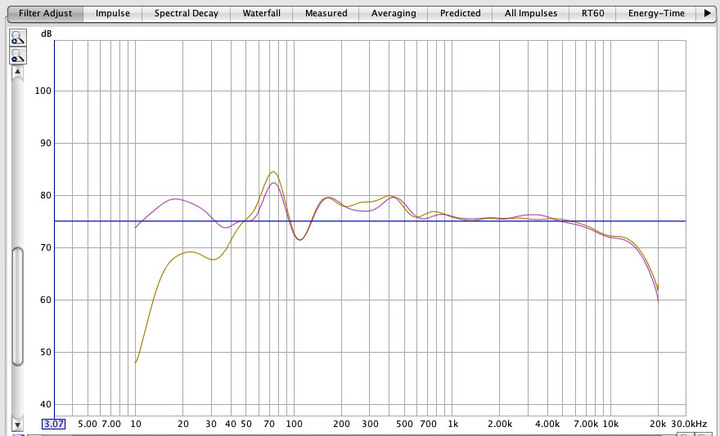
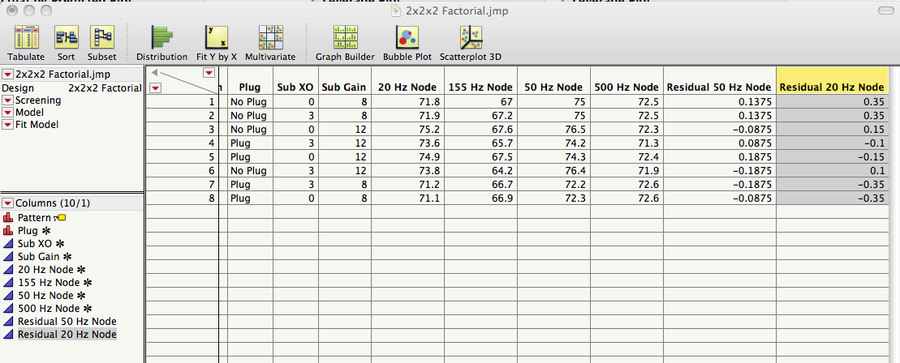
Here is the result of analyzing the 20 Hz response of the DOE. We can see from the actual by predicted plot that the R^2 and r^2 adjusted are strongly correlated at 0.97 and 0.94, respectively, indicating that our results fit our model pretty well. Also the leverage plots (the factors affecting the response (20Hz output), show that Sub gain has a large effect, and quite possibly that the interaction of sub gain and sub crossover may have an effect, as the p-value is just barely above p>-.05, which tends to suggest there may be a significant effect if we gather more data or relax our confidence level from 95% to 90%. In, fact, if we relax our alpha from 5% (the chance we are willing to accept that we are wrong) to 10%, then the Sub crossover point becomes significant. In addition, our analysis of variance with probability of F >0.0016, suggests that that this result occurred from our null hypothesis, that the model does not predict sub 20 Hz performance is very low. The interaction profile plots also suggest that there is a likely interaction between sub XO setting and sub gain, and the plot lines are not perfectly parallel, but appear to intersect. Looking at the Prediction Profiler from JMP, comparing Sub gain with Sub XO, we can see that the maximum 20 Hz response is obtained by the Sub gain at 12 clicks up, and sub set at zero clicks, and we could expect a level of 75.1875 dB. JMP is also cool because it will show you a 3-D image of two factors at one time as they affect the desired response in a 3-D cube, in this case, the 20 Hz response. As you can see, the upper left corner of the rectangle shows, which is max 20 Hz response is at a sub crossover of zero, and a gain setting of 12. These analyses show how you can utitlize DOE to predict with good confidence the response from setting the factors (crossover point and gain) to give the desired response at 20 Hz. I used this approach then to measure the BEFORE and AFTER responses, in this graph, BEFORE is BLUE and AFTER is GREEN. Note how much smoother the overall frequency response is for the green trace.
-
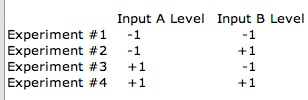
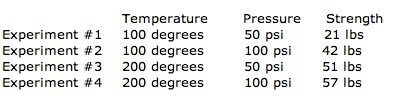
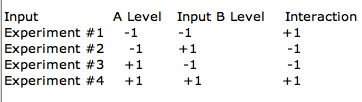
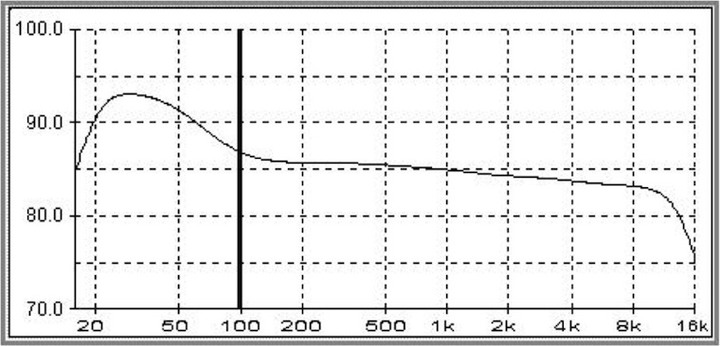
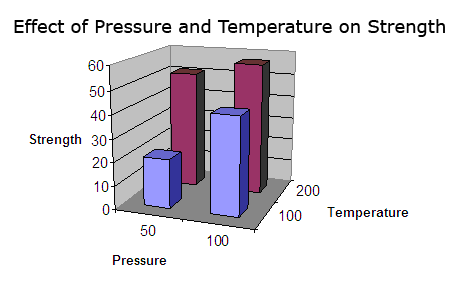
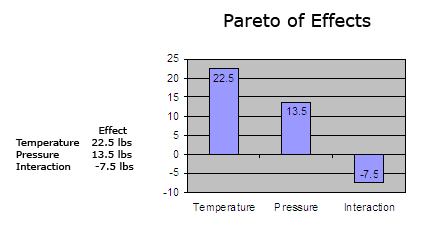
Hi Guys, I thought I'd a share a robust, real-world experimental, statistically-based technique called [i]Design of Experiments[/i] to optimize setup of a REL sub into my 2-channel stereo system. For those interested, first I'm posting an introduction to Design of Experiments here: _________________ When I started to look at how to effectively integrate my REL R-305 subwoofer with a pair of "mains" speakers using a statistical approach called Design of Experiments to optimize integration of subwoofers for a given room with a set of "mains" speakers. To start with here is an introduction to Design of Experiments. Description Design of experiments (DOE) is a powerful tool that can be used in a variety of experimental situations. DOE allows for multiple input factors to be manipulated determining their effect on a desired output (response). By manipulating multiple inputs at the same time, DOE can identify important interactions that may be missed when experimenting with one factor at a time. All possible combinations can be investigated (full factorial) or only a portion of the possible combinations (fractional factorial). Fractional factorials will not be discussed here. When to Use DOE Use DOE when more than one input factor is suspected of influencing an output. For example, it may be desirable to understand the effect of temperature and pressure on the strength of a glue bond. DOE can also be used to confirm suspected input/output relationships and to develop a predictive equation suitable for performing what-if analysis. DOE Procedure Acquire a full understanding of the inputs and outputs being investigated. A process flow diagram or process map can be helpful. Utilize subject matter experts as necessary. Determine the appropriate measure for the output. A variable measure is preferable. Attribute measures (pass/fail) should be avoided. Ensure the measurement system is stable and repeatable. Create a design matrix for the factors being investigated. The design matrix will show all possible combinations of high and low levels for each input factor. These high and low levels can be generically coded as +1 and -1. For example, a 2 factor experiment will require 4 experimental runs: Note: The required number of experimental runs can be calculated using the formula 2n where n is the number of factors. For each input, determine the extreme but realistic high and low levels you wish to investigate. In some cases the extreme levels may be beyond what is currently in use. The extreme levels selected should be realistic, not absurd. For example: Enter the factors and levels for the experiment into the design matrix. Perform each experiment and record the results. For example: Calculate the effect of a factor by averaging the data collected at the low level and subtracting it from the average of the data collected at the high level. For example: Effect of Temperature on strength: (51 + 57)/2 - (21 + 42)/2 = 22.5 lbs Effect of Pressure on strength: (42 + 57)/2 - (21 + 51)/2 = 13.5 lbs The interaction between two factors can be calculated in the same fashion. First, the design matrix must be amended to show the high and low levels of the interaction. The levels are calculated by multiplying the coded levels for the input factors acting in the interaction. For example: Calculate the effect of the interaction as before. Effect of the interaction on strength: (21 + 57)/2 - (42 + 51)/2 = -7.5 lbs The experimental data can be plotted in a 3D Bar Chart. This simple-minded example above shows that there is an interaction between temperature and pressure in the strength of the glue bond. This is one feature of DOEs that is particularly useful when looking at the effect of a number of factors and their effect on the critical functional response. Now that that is out of the way as intro, let's look at the specific experiment I had in mind in the next post. The experiment I was trying to reproduce was the one based on the well-known "Harman curve" showing that listeners perceived a room as having flat room reponse when the measured frequency actually looked more like this. This is because our hearing is not linear at lower frequencies. Now, one could debate whether the Harman curve is exactly the right curve on which to base this model, but it was a well-characterized "orthogonal reference" as we say in science, and as such, it was the one I decided to use for this experiment. Please keep in mind this was just an experiment I did [i]for fun[/i] while recovering from a back opera tion. What can I say...this is how scientists like myself are "wired"... :lol: Given this, I set out to to perform a "DOE" to see if I could determine the optimal settings of speakers, REL sub settings and other factors, like grilles on or off, speaker toe-in, port plugs, etc. that would optimize the in-room response. With that in mind, I set out to see what I could do with my set-up to obtain, as close as possible, the Harman response curve via DOE. System used at the time was: Conrad-Johnson Premier 17LS Preamp, Conrad-Johnson LP70S, Dynaudio Contour S3.4 speakers, REL R-305, M-Audio MobilePre USB mike preamp, Dayton NIST-traceable calibrated measurement microphone with calibration file, and Room EQ Wizard Software. The Room EQ Wizard software generates and simultaneously measures the frequency sweep from 10 Hz to 20,000 Hz. The desired responses were to maximize 20 and 50 Hz repsonse in dB, and minimize the 150 and 500 Hz responses. These 150 and 500 Hz responses were nodes that I wanted to minimize, if possible. An example trace as my starting point for reference is shown. The purple trace is where I started with the sub in, the brown trace with the sub out, before optimizing things using the DOE approach. The following is the real-time, IN-ROOM measured response for the right speaker: The goal here was to maximize the 20-50Hz node to range, while smothing the 70, and minimizing the 105, 155 and 500 Hz node peaks, so as to emulate the JBL graph. The factors I used for the DOE were sub gain (as clicks up from zero), sub crossover, likewise clicks up from zero, plug or no plug in the speaker reflex port. So, four responses being measured as the result of 3 factors at two different levels (low, high as in the examples above shown). Setting up a full-factorial DOE in JMP (a stastical package), here are the experimental matrix I ran per JMP's output for the experimental design and the ACTUAL measurements for each frequency (as measured in dB by room Eq Wizard). The next post will be the analysis of the data.
-
Oh, man! Are you in for a surprise! Please update once you install it and as it has "settled in". I already know how this is gonna go, though...heheheh. Cheers! 😆
-
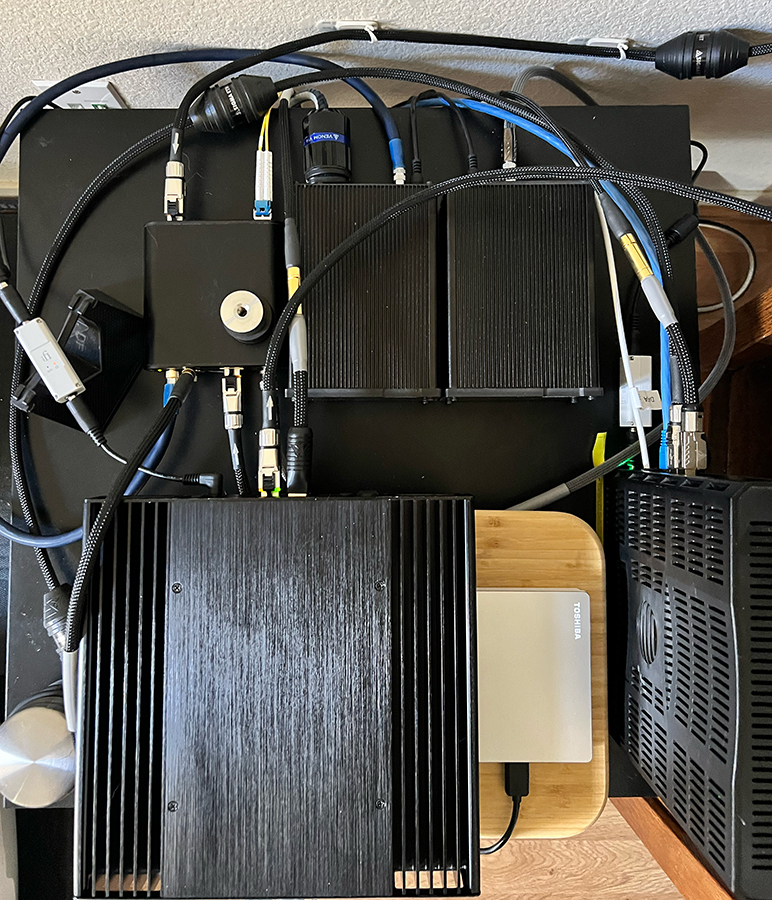
Chris, Be sure to also use the Altaira-based grounding system on Gemini. It's there for very sound and specific reasons, and it will take your headphone system to yet another significant level. You can use a range of ground cable types (If possible, use Shunyata Alpha-specification ground cables) with it, for example, connecting a Shunyata ground cable with the appropriate tail (e.g. USB, Ethernet, RCA, XLR, etc.) to one or more unused USB, SPDIF, Ethernet ports on the Lina DAC and headphone amp will provide notably better performance than you've already experienced. I use Gemini as the power distributor and Altaira ground-plane noise reduction hub in my "remote server room" to power my Akasa-cased NUC Roon Core, Pace Router, and the AfterDark LPS that powers EtherREGEN and my AfterDark Master Clock. Here's a shot of the Akasa-cased NUC. This remote music server set-up ultimately runs via LC/LC fiber out of ER to my Lumin P1's SFP cage in my main audio rack in another room (and you know how good the P1 is...). Here's a front view of the set-up with the Akasa NUC Roon Core, which I've named Alita (as in Alita, Battle Angel). EtherREGEN and the AfterDark clock and LPS sit behind it. Below, you can see Alpha ground cables attached to EtherREGEN's ground terminal with spade connector (thank you, John Swenson, for putting a ground terminal on ER!👍) and from an unused USB-A port on Alita, and the Venom CGC that is the top-most cable from an RJ45 port on the back of the Pace router. I run the Alpha and Venom ground Cables from EtherREGEN, Alita, and the RJ45 port on the router as shown in the photo above, down to the Altaira-type GP-NR terminals on Gemini, as shown here, which sits below the Lack table the remote music server sits on. Here's a key point: if you're not using the Shunyata Altaira ground-plane noise reduction technology that is in Gemini, trust me when I say this...you should be. It's there for a reason, and knowing Shunyata, you know they wouldn't put it there unless it really provides a significant functionality. It does; the Altaira ground-plane noise reduction hubs and the system in Gemini are a veritable breakthrough for audio quality (read Harley's review of the Altaira system in TAS 334). As the gang can see, Gemini also makes for a perfect power distributor not just headphone set-ups, but for "remote music server room" applications, as well, as I've shown here. These music server components really benefit from clean, quiet power AND appropriate ground-plane noise reduction. Cheers. Cheers, Stephen aka PC
-
A truly brilliant engineer. RIP Tim de Paravicini.
-
UpTone Audio EtherREGEN Listening Impressions
Puma Cat replied to mourip's topic in UpTone Audio (Sponsored)
Thank you. I put considerable effort into writing it. At over 4000 words, it was a LOT of work. Thanks also to Alex and John providing very informative technical design information to ensure I was describing the unique features and functionality of EtherREGEN accurately. The design embodiment and functionality of EtherREGEN goes "pretty deep" (trust me on this) but it results in a singularly excellent and unique product. -
UpTone Audio EtherREGEN Listening Impressions
Puma Cat replied to mourip's topic in UpTone Audio (Sponsored)
Hi Alex, Thanks for the update that the EtherREGEN review is out in the print issue of TAS for December, 2020. I haven't received my issue yet as I have a digital subscription (😉). Congrats on the new Honda Ridgeline, I have friends that own them and they are very, very happy with them. I've been driving and riding Honda Motor Co. products for the better part of 40 years, so I am big fan of the company. Enjoy your new wheels! All best, Stephen -
The new Sonore opticalModule Deluxe
Puma Cat replied to R1200CL's topic in Networking, Networked Audio, and Streaming
Alex, thanks very much for providing this important clarification. Jim, just so that I am perfectly clear, when I stated above that "everything works fine", I meant that from a strictly functional perspective, i.e., this set-up would function. Alex is 100% correct that the optimal configuration for best possible audio quality is to have OM upstream at the "network end" and ER downstream, at the network bridge or optical "endpoint" and on to the DAC. in particular, to take full advantage the completely isolated power/clock/data domain on ER 'B' side. And, this how I have my OM/ER system set up (see my system description below in the footer). Cheers. -
The new Sonore opticalModule Deluxe
Puma Cat replied to R1200CL's topic in Networking, Networked Audio, and Streaming
Hi JIm, thanks for your reply. It actually it works fine for an optical setup because the the optical connection on A-side of ERe operates at the gigabit rate. So, you can have the ER upstream (in through B-side, out through A-side SFP, and on down to the OM SFP Gigabit downstream, connected via fiber, and everything works fine (I've done this). But I think what you're saying is that if you went out of B-side of ER to the RJ45 copper Ethernet port on the original OM (so that you could go out via optical fiber, to say, an OpticalRendu, it wouldn't work because of the RJ45 port mismatch between B-side ER (100 megabytes) vs the RJ45 port on OM (Gigabit). I think I've got that right....😜 😀 Please correct me if I'm wrong. Cheers. -
The new Sonore opticalModule Deluxe
Puma Cat replied to R1200CL's topic in Networking, Networked Audio, and Streaming
I agree. Its not handled eloquently, nor is it informative. Its not at all clear to me why one would purchase this as opposed to the original OM, other than it has the RJ45 port and SFP cage on the same side of the device. What I would to know is if the new ultlralow noise voltage regulators, or crystal oscillator are higher specification that in the original OpticalModule, or not. And if so, which ones are used? Also, what does "supports flow control" mean, exactly? So, my question is, why would I decide to buy this as opposed to the original OM? It's not clear from the web page or specifications. -
Great post. I'll just add some additional info for context here. In the medical imaging arena, where the products of Shunyata Research's sister company, Clear Image Scientific, have developed a range of products that have been a breakthrough in digital medical imaging, the doctors who use these products don't get into "arguments" about whether a power can make a difference, because....they use these products to save people's lives.
-
Excelllent post. As someone who spent his entire career as a professional scientist, and am first-author of papers published in Science, The Proceedings of the National Academy of the Sciences, American Journal of Human Genetics, Blood, etc., I agree with your points. Oh, and BTW, the Principia Mathematica was not peer-reviewed.